
Leadership
| Arden Kucate, Governor |
| Cordelia Hooee, Lt. Governor |
| Anthony Sanchez Jr., Head Councilman |
| Shirley Bellson, Council Member |
| Virginia Chavez, Council Member |
| Ricky R. Penketewa Sr., Council Member |
| Birdena Sanchez, Council Member |
| Edward Wemytewa, Council Member |
(updated October 2025)
Contact Information
Address: PO Box 339, 1203B State Hwy 53, Zuni, NM 87327
Phone: 505-780-7024
Program Manager, Zuni Wellness Center:
Carleton Albert Sr. carleton.albertsr@ashiwi.org
Education Director:
Bernadette Panteah bernadette.panteah@ashiwi.org
GOVERNANCE: The Pueblo of Zuni are governed by a Governor, Lieutenant Governor, and six council members. Council members serve consecutive four-year terms. The Pueblo of Zuni is in Congressional District 1; Legislative District 7.
CONSTITUTION:
PERSPECTIVE ON RESEARCH:
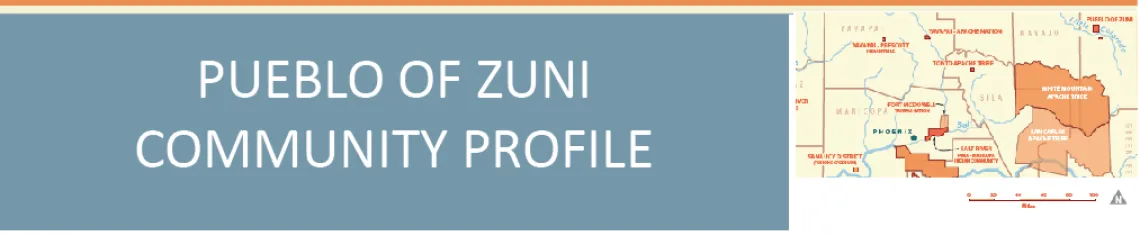
COMMUNITY PROFILE: Europeans first discovered Zuni territory in the 1500s. In 1680, Pueblos (including Zuni) in New Mexico planned and revolted against Spanish domination. After attacking and burning a Spanish Mission, the population of all Zuni villages sought refuge on the sacred mountain (Corn Mesa) until 1692. After the Spanish made peace with the Zuni, the people settled in what is now present-day Zuni Pueblo. The main Reservation is 450,000 acres 150 miles west of Albuquerque. The tribe also has land in Catron County, New Mexico, and Apache County, Arizona.
The Zuni have established programs to promote the unique spoken-only Zuni language into a written language form. According to the Census, approximately 85 percent of the Tribe speaks the Zuni language.
The Zuni Pueblo is an artist colony, with the main industry being inlay silverwork, stone fetish carving, pottery, and other artwork.
According to the U.S. Census Bureau 2018-2022 American Community Survey, the population of the Pueblo of Zuni Reservation and Off-Reservation Trust Land is 8,134. The following document provides a Census snapshot of the Pueblo of Zuni with comparisons to the state of Arizona and the United States as a whole.
Note: when interpreting data for small populations or rural areas, it is important to note the margin of error, which is provided where possible. The margin of error can be interpreted as providing a 90 percent probability that the true value lies within the estimate plus and minus the margin of error.
See below for a few select health and community resources on the Pueblo of Zuni Reservation.
- Pueblo of Zuni long-term services and supports (LTSS) programs for elders
- Zuni Comprehensive Health Center
The following reports summarize the businesses and market predictions on the Zuni Reservation.